April 8-16, 2008
Modeling P2P traffic
The AP389 is a p2p dominant AP. From this AP ploumidis isolated p2p
sessions initialy from different applications and afterwards from applications
that use the gnutella protocol. Ploumidis gave me 2 traces of downloaded P2P
traffic
·
in-session flow
interarrivals
·
flow sizes
The aim is to model the in-session flow interarrivals and the flow
sizes. Do they follow a specific distribution as the traffic in web-dominant
APs?
We wanted also to model the number of in-session flows – how many flows
a sessions produces – but this was impossible (only 3 sessions were produced)
For more information http://www.csd.uoc.gr/~ploumid/ics/April%202008.htm
All Applications
In-session flow
interarrivals
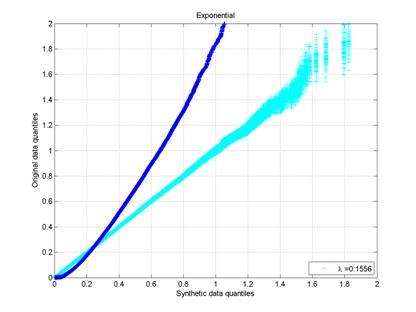
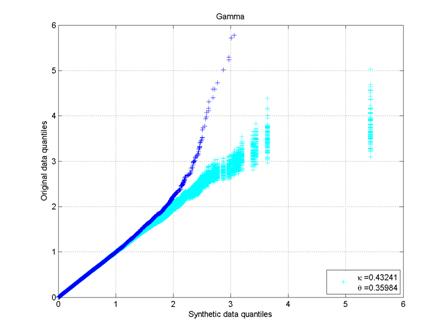
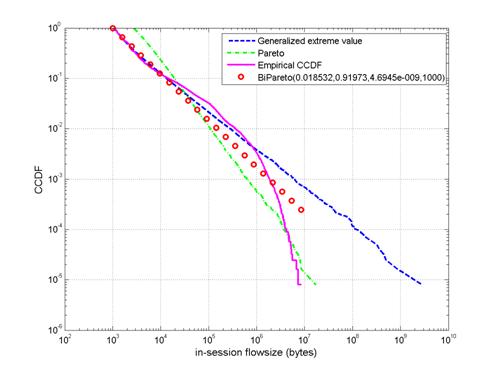
From the flowInterarrivalsP2Phomogenous.dat.gz trace I created the ccdf and QQplots for the
distributions:
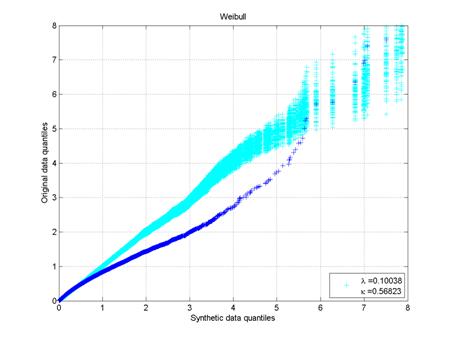
* Weibull
* Lognormal
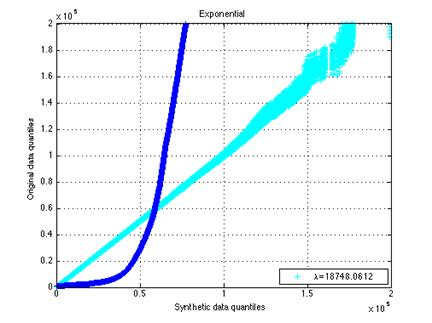
* Exponential
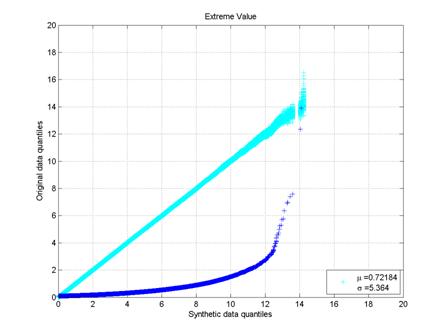
* Extreme value
* Generalized extreme value
* Pareto
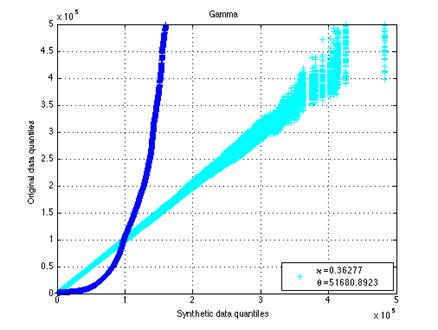
* Gamma
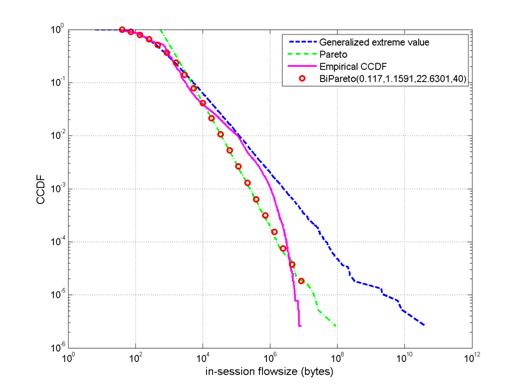
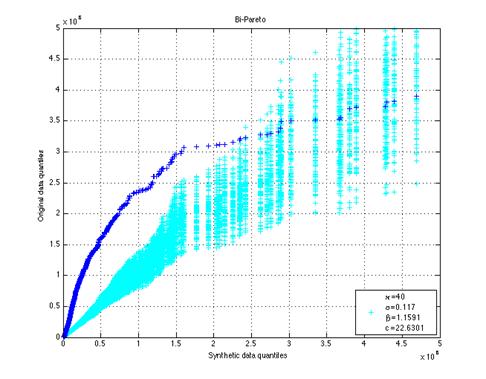
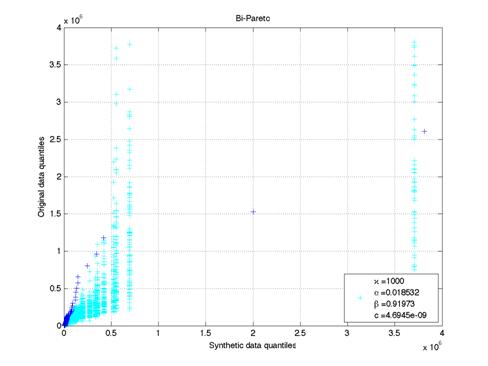
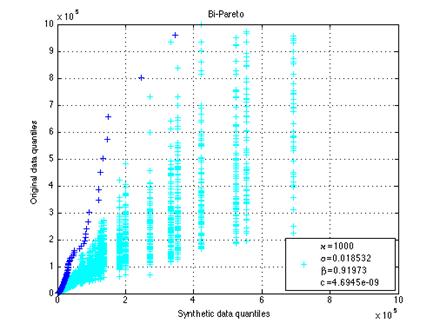
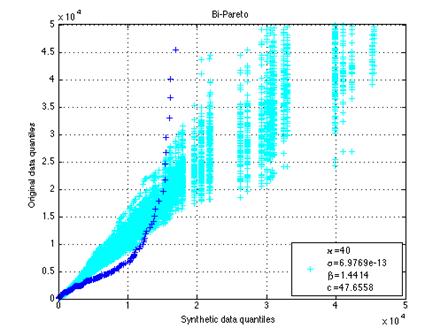
* Bipareto
Tsopanidis improved the initial matlab code I have created for the
qqplots in order to run faster and produced the bipareto plots.
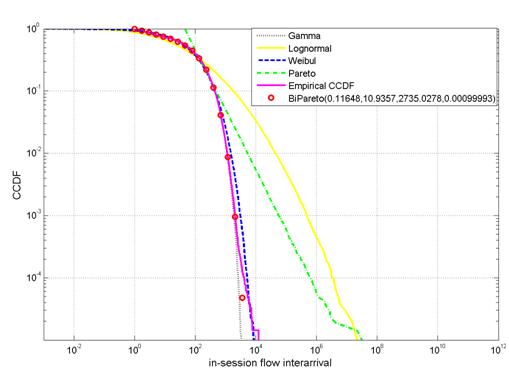
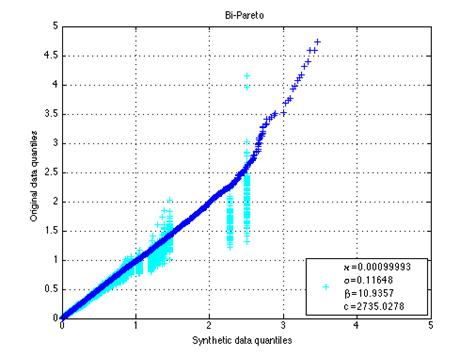
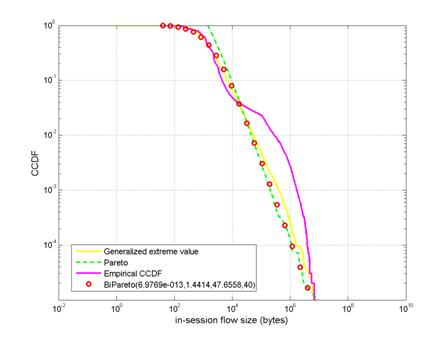
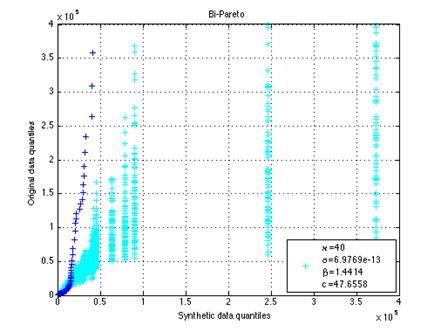
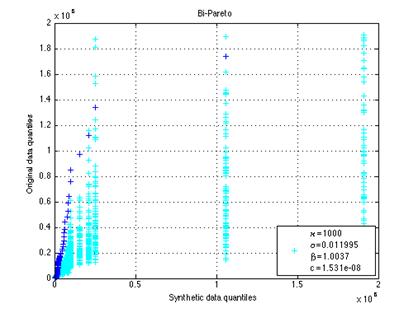
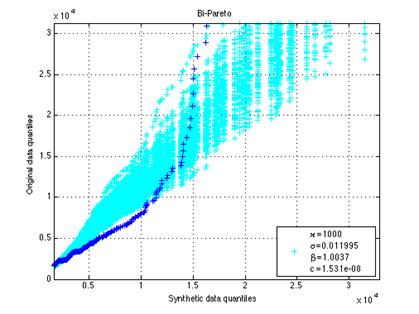
As we can see from
the ccdf plot and the qqplot of the bipareto distribution with the emprirical
data, in-session flow interarrivals for various p2p applications follow a
bipareto distribution.
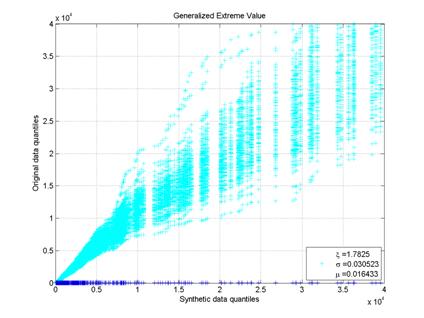
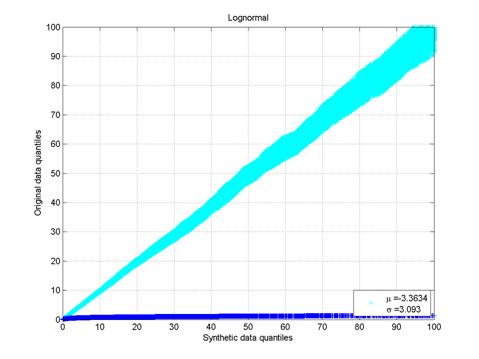
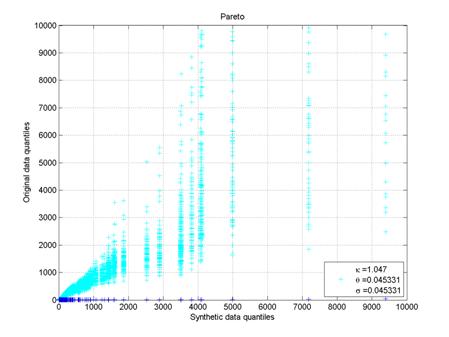
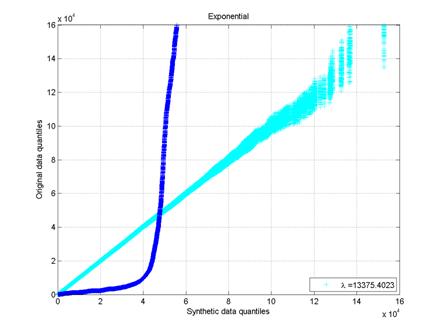
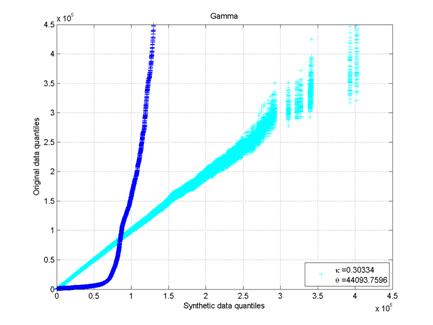
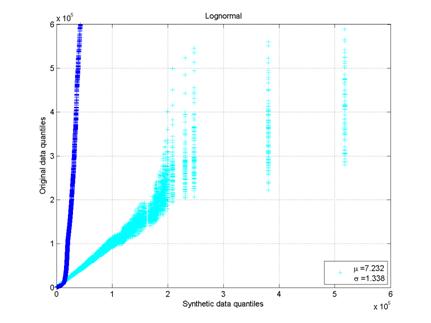
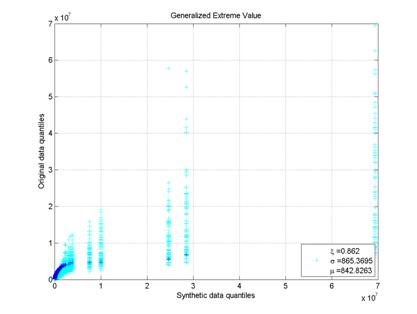
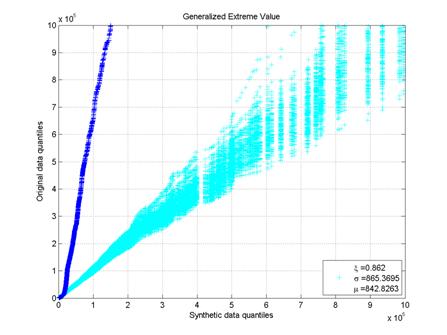
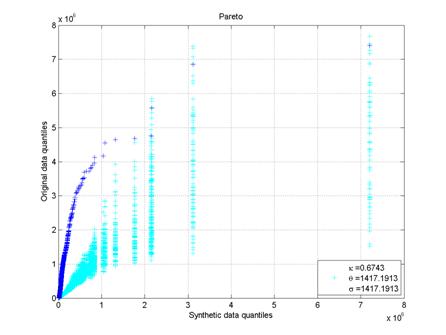
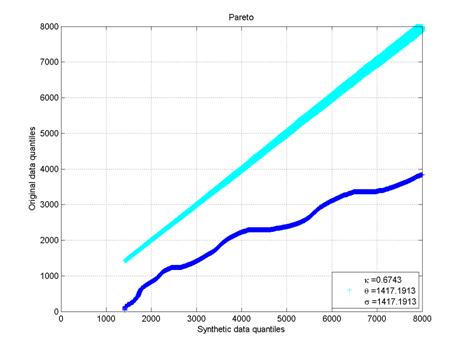
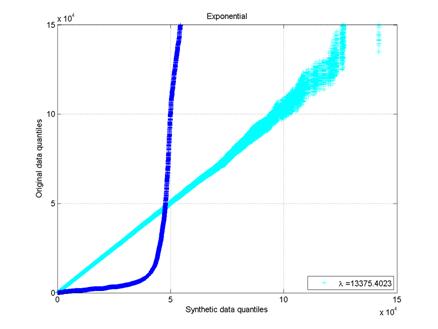
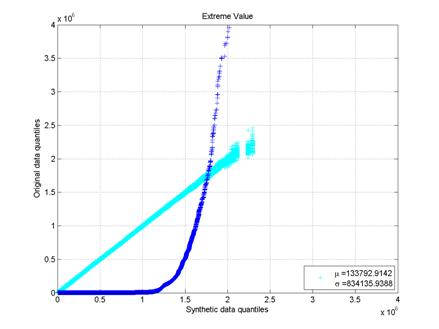
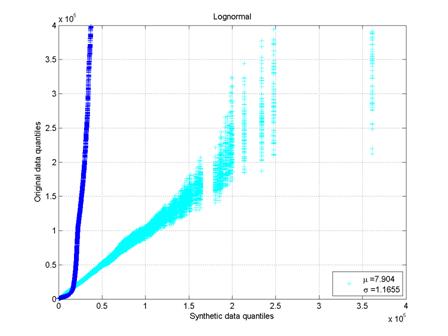
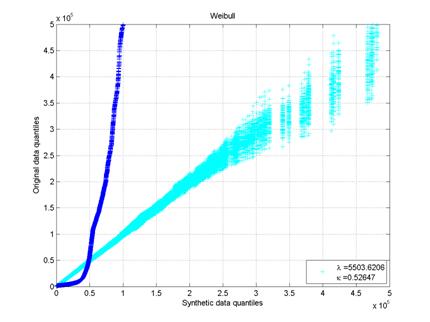
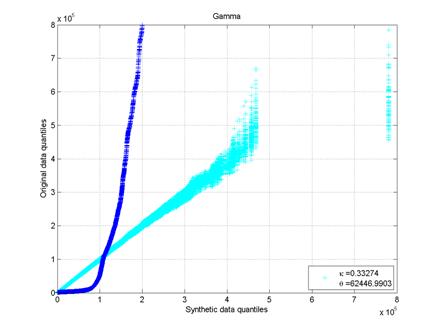
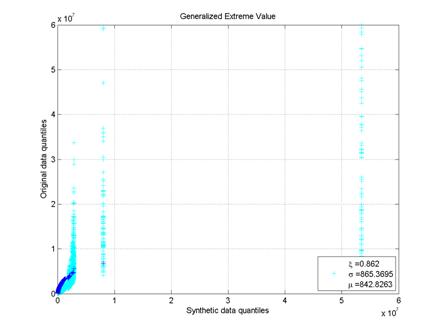
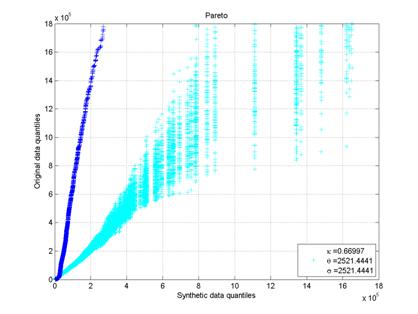
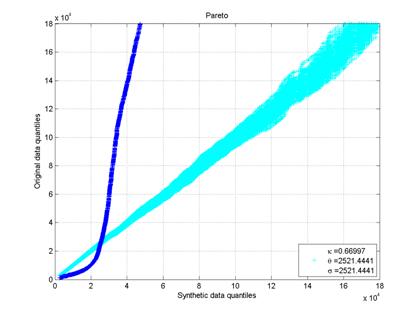
Flowsizes
From the _p2pflowsizes_homogenousSession389_thes90.dat.gz trace I created the ccdf and QQplots for the
distributions:
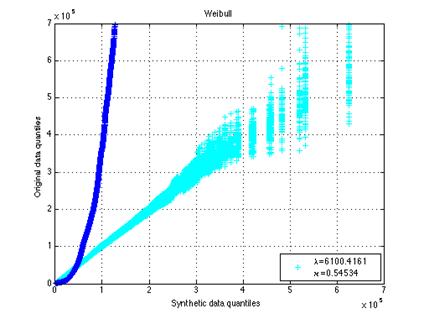
* Weibull
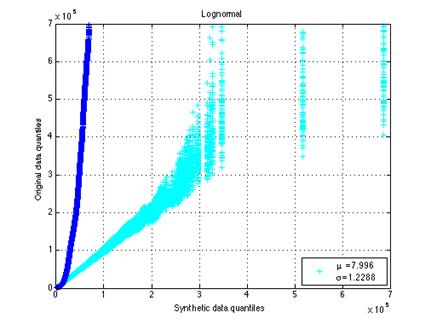
* Lognormal
* Exponential
* Extreme value
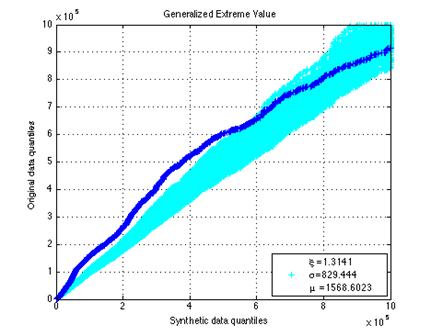
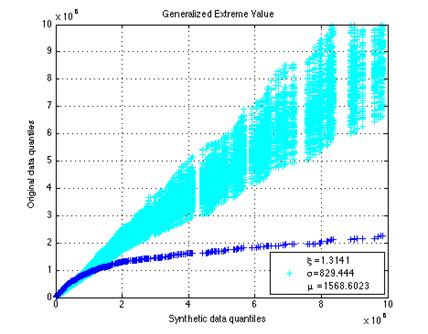
* Generalized extreme value
* Pareto
* Gamma
* Bipareto
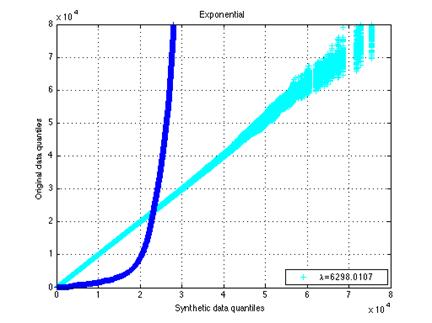
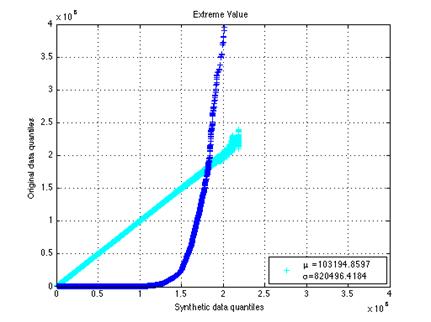
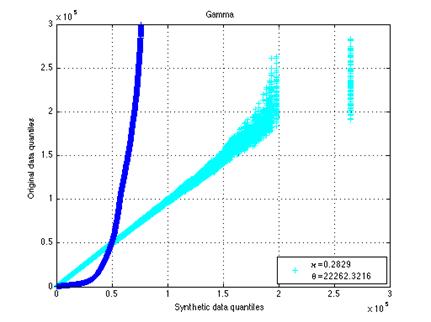
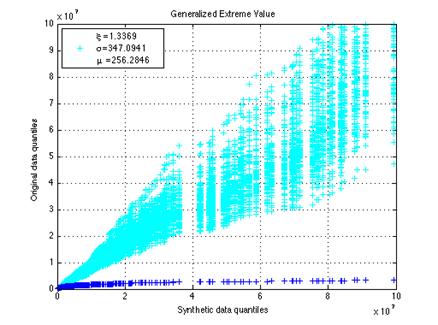
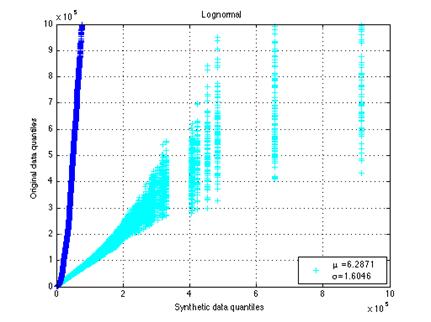
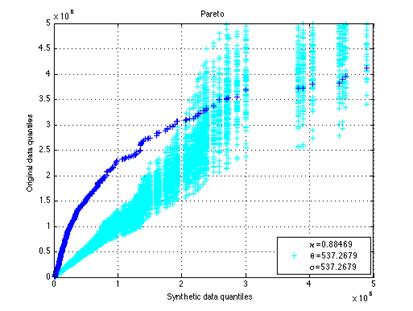
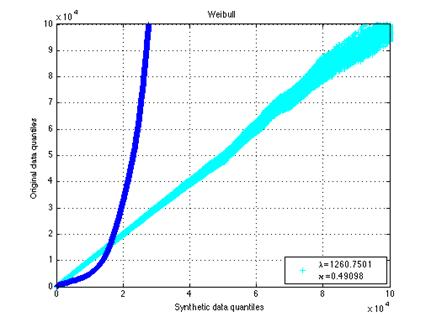
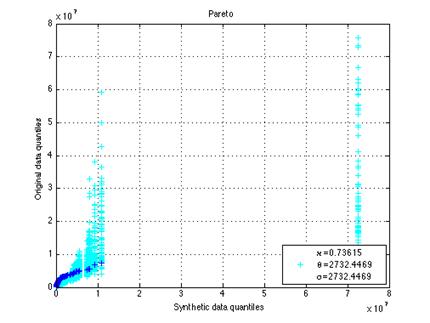
As we can see no distribution
fits our empirical data.
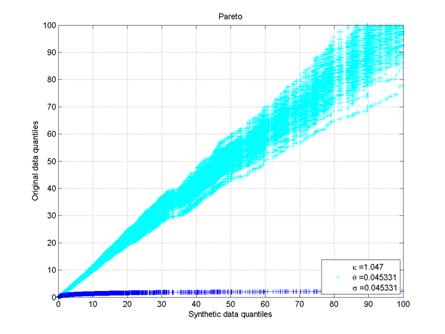
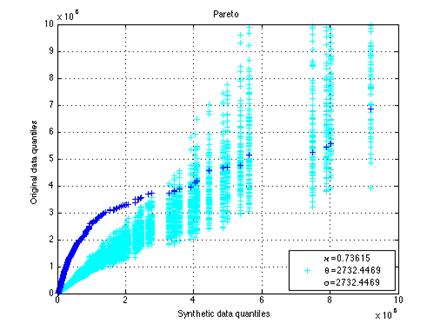
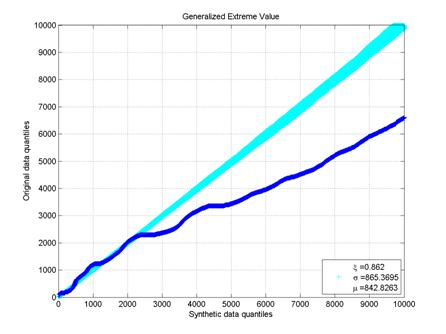
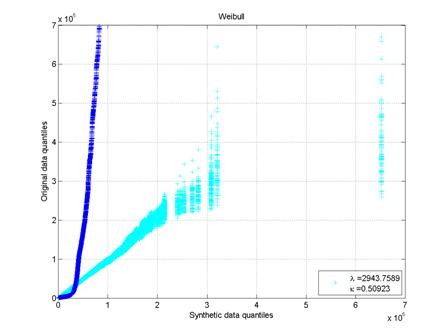
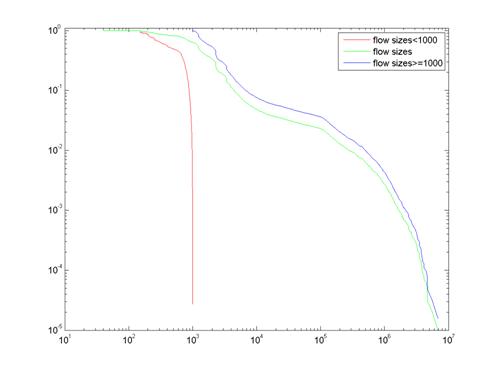
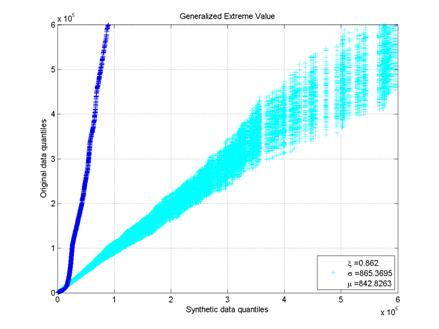
Flowsizes
>1000 bytes
We also made the ccdf plot and
qqplots for flow sizes>1000bytes:
April 17, 2008
Gnutella
protocol
Ploumidis
produced a trace with gnutella flows only. From this trace we will try to model
p2p traffic for the flowsizes only since we have reached a model for in-session
flow interarrivals.
Flowsizes

Flowsizes>1000 bytes
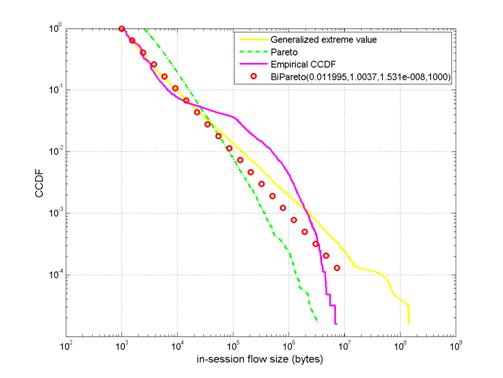
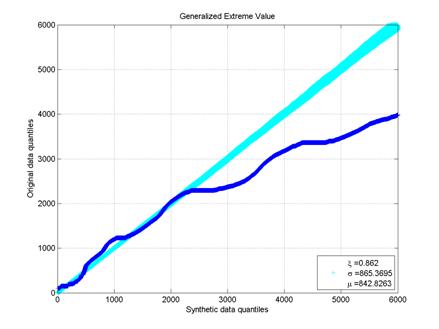
We could
not find any distribution to model in-session p2p flowsizes.
April 21, 2008
Assigned
the task to run harpoon. Full report can be found here.